Note
Go to the end to download the full example code.
Tutorial for hole generation in tabular data
In this tutorial, we show how to use the different hole generator classes
in a time series data case. In particular, we show how to use the
UniformHoleGenerator,
GeometricHoleGenerator,
EmpiricalHoleGenerator,
MultiMarkovHoleGenerator
and GroupedHoleGenerator
classes.
We use Beijing Multi-Site Air-Quality Data Set.
It consists in hourly air pollutants data from 12 chinese nationally-controlled
air-quality monitoring sites.
from typing import List

import matplotlib
import matplotlib.pyplot as plt
import numpy as np
import pandas as pd
from sklearn import utils as sku
from torch import rand

from qolmat.benchmark import missing_patterns
from qolmat.utils import data

seed = 1234
rng = sku.check_random_state(seed)
1. Data
We use the public Beijing Multi-Site Air-Quality Data Set.
It consists in hourly air pollutants data from 12 chinese nationally-controlled
air-quality monitoring sites.
For the purpose of this notebook,
we corrupt the data, with the qolmat.utils.data.add_holes function.
In this way, each column has missing values.
df_data = data.get_data("Beijing")
The dataset contains 18 columns. For simplicity, we only consider some.
columns = ["TEMP", "PRES", "DEWP", "RAIN", "WSPM"]
df_data = df_data[columns]

df = data.add_holes(df_data, ratio_masked=0.2, mean_size=120, random_state=rng)
cols_to_impute = df.columns
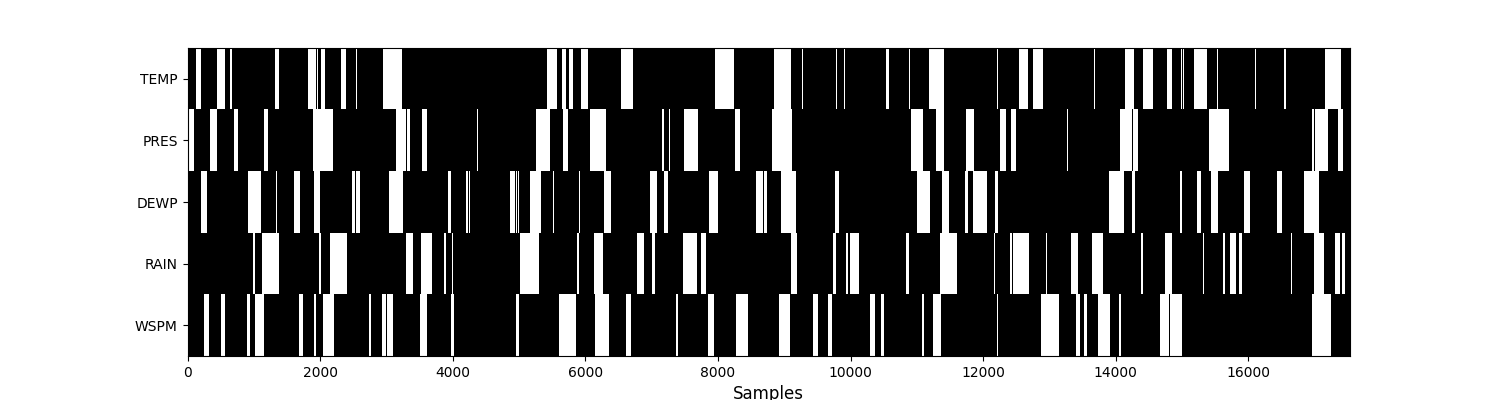
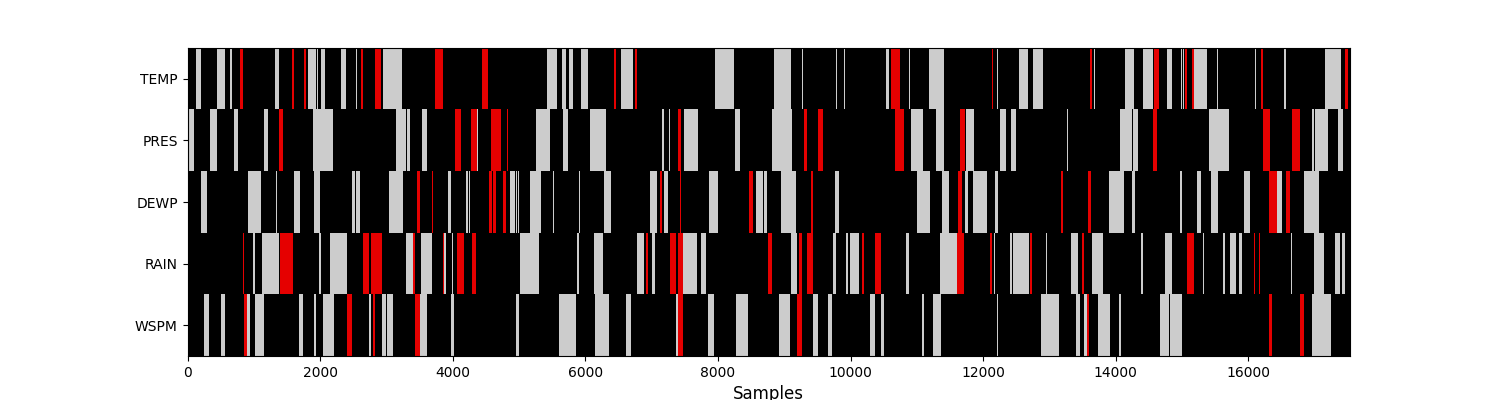
Let’s visualise the mask (i.e. missing values) of this dataset. Missing values are in white, while observed ones are in black.
plt.figure(figsize=(15, 4))
plt.imshow(
    df.notna().values.T, aspect="auto", cmap="binary", interpolation="none"
)
plt.yticks(range(len(df.columns)), df.columns)
plt.xlabel("Samples", fontsize=12)
plt.grid(False)
plt.show()
2. Hole generators
Given a pandas dataframe df, the aim of a hole generator
is to create n_splits masks, i.e. a list of dataframes,
where each dataframe has the same dimension
as df with missing entries np.nan. The missing entries of the mask
cannot be missing in the initial dataframe.
This is achieved with the split function, and it works in the same way
than Kfolds of scikit-learn.
For each method, we will generate 10 percent missing values, i.e.
ratio_masked=0.1, and we will generate missing values
for all the columns in the dataframe, i.e. subset=df.columns.
Since the exercise here is simply to show how to generate missing data,
the n_splits argument is not important.
We therefore set it to 1.
Let’s just define a function to visualise the additional
missing values.
def visualise_missing_values(df_init: pd.DataFrame, df_mask: pd.DataFrame):
    """Visualise the missing values in the final dataframe
    with different colors for initial (white) and
    additional (red) missing values.

    Parameters
    ----------
    df_init : pd.DataFrame
        initial dataframe
    df_mask : pd.DataFrame
        masked dataframe

    """
    df_tot = df_init.copy()
    df_tot[df_init.notna()] = 0
    df_tot[df_init.isna()] = 2
    df_mask = np.invert(df_mask).astype("int")
    df_tot += df_mask
    colorsList = [(0.9, 0, 0), (0, 0, 0), (0.8, 0.8, 0.8)]
    custom_cmap = matplotlib.colors.ListedColormap(colorsList)
    plt.figure(figsize=(15, 4))
    plt.imshow(
        df_tot.values.T, aspect="auto", cmap=custom_cmap, interpolation="none"
    )
    plt.yticks(range(len(df_tot.columns)), df_tot.columns)
    plt.xlabel("Samples", fontsize=12)
    plt.grid(False)
    plt.show()


def get_holes_sizes_column_wise(data: np.ndarray) -> List[List[int]]:
    """Get the hole size distribution of each column of an array.

    Parameters
    ----------
    data : np.ndarray

    Returns
    -------
    List[List[int]]
        List of hole size for each column.

    """
    hole_sizes = []
    for col in range(data.shape[1]):
        current_size = 0
        column_sizes = []
        for row in range(data.shape[0]):
            if np.isnan(data[row, col]):
                current_size += 1
            elif current_size > 0:
                column_sizes.append(current_size)
                current_size = 0
        if current_size > 0:
            column_sizes.append(current_size)
        hole_sizes.append(column_sizes)
    return hole_sizes


def plot_cdf(
    df: pd.DataFrame,
    list_df_mask: List[pd.DataFrame],
    labels: List[str],
    colors: List[str],
) -> None:
    """Plot the hole size CDF of each column.
    Comparison between original and created holes.

    Parameters
    ----------
    df : pd.DataFrame
        original dataframe with missing data
    list_df_mask : List[pd.DataFrame]
        crated masks, list of boolean dataframe
    labels : List[str]
        list of labels
    colors : List[str]
        list of colors

    """
    _, axs = plt.subplots(1, df.shape[1], sharey=True, figsize=(15, 3))

    hole_sizes_original = get_holes_sizes_column_wise(df.to_numpy())
    for ind, (hole_original, col) in enumerate(
        zip(hole_sizes_original, df.columns)
    ):
        sorted_data = np.sort(hole_original)
        cdf = np.arange(1, len(sorted_data) + 1) / len(sorted_data)
        axs[ind].plot(sorted_data, cdf, c="gray", lw=2, label="original")

    for df_mask, label, color in zip(list_df_mask, labels, colors):
        array_mask = df_mask.astype(float).copy()
        array_mask[df_mask] = np.nan
        hole_sizes_created = get_holes_sizes_column_wise(array_mask.to_numpy())

        for ind, (hole_created, col) in enumerate(
            zip(hole_sizes_created, df.columns)
        ):
            sorted_data = np.sort(hole_created)
            cdf = np.arange(1, len(sorted_data) + 1) / len(sorted_data)
            axs[ind].plot(sorted_data, cdf, c=color, lw=2, label=label)
            axs[ind].set_title(col)
            axs[ind].set_xlabel("Hole sizes")

    axs[0].set_ylabel("CDF")
    plt.legend()
    plt.tight_layout()
    plt.show()
a. Uniform Hole Generator
The holes are generated randomly, using the resample method of scikit learn.
Holes are created column by column. This method is implemented in the
UniformHoleGenerator class.
Note this class is more suited for tabular datasets.
uniform_generator = missing_patterns.UniformHoleGenerator(
    n_splits=1, subset=df.columns, ratio_masked=0.1, random_state=rng
)
uniform_mask = uniform_generator.split(df)[0]

print("Percentage of additional missing values:")
print(round((uniform_mask.sum() / len(uniform_mask)) * 100, 2))
visualise_missing_values(df, uniform_mask)

Percentage of additional missing values:
TEMP    10.0
PRES    10.0
DEWP    10.0
RAIN    10.0
WSPM    10.0
dtype: float64
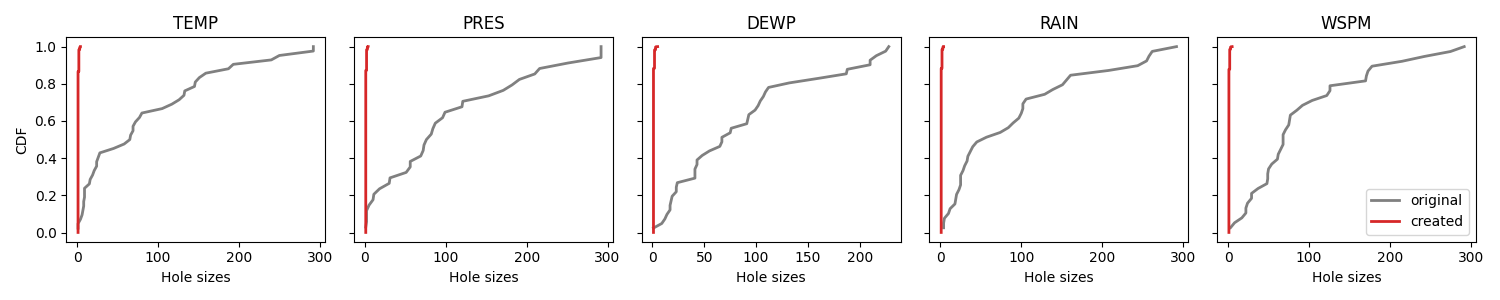
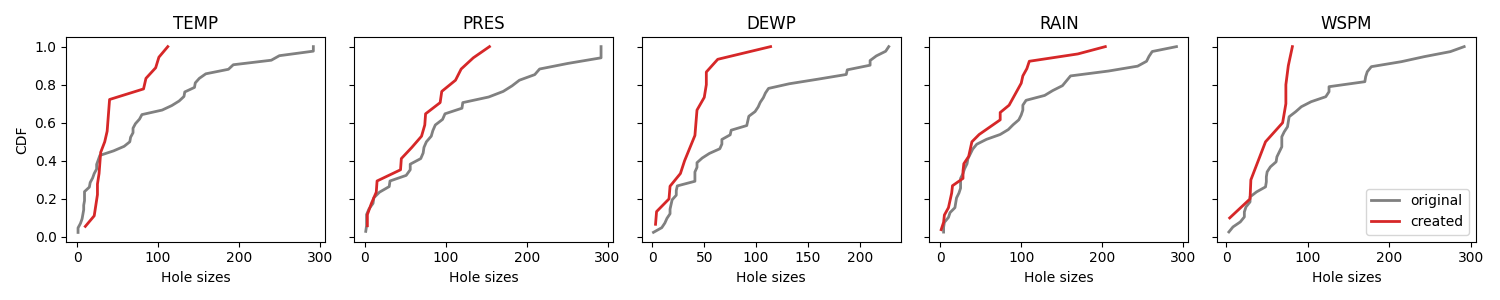
We plot the cumulative distribution functions of the original hole sizes. and the generated holes. Since we are creating randomly and uniformly, the distributions are very different.
plot_cdf(df, [uniform_mask], ["created"], ["tab:red"])
b. Geometric Hole Generator
The holes are generated following a Markov 1D process.
Holes are created column by column. The transition matrix of the
one-dimensional Markov process is learned from the data.
This method is implemented in the
UniformHoleGenerator class.
geometric_generator = missing_patterns.GeometricHoleGenerator(
n_splits=1, subset=cols_to_impute, ratio_masked=0.1, random_state=rng
)
geometric_mask = geometric_generator.split(df)[0]
print("Percentage of additional missing values:")
print(round((geometric_mask.sum() / len(geometric_mask)) * 100, 2))
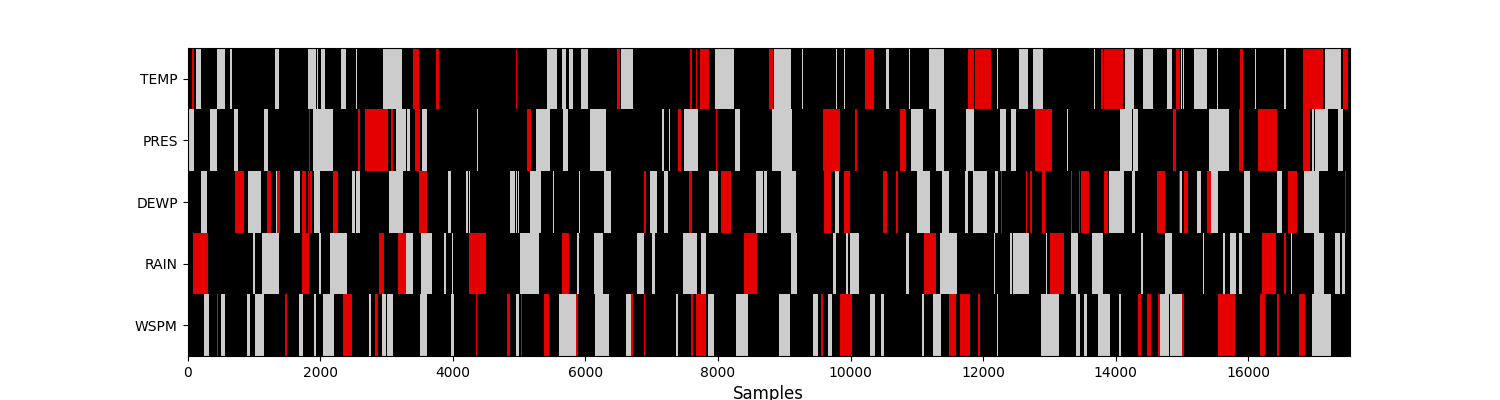
visualise_missing_values(df, geometric_mask)
Percentage of additional missing values:
TEMP    10.0
PRES    10.0
DEWP    10.0
RAIN    10.0
WSPM    10.0
dtype: float64
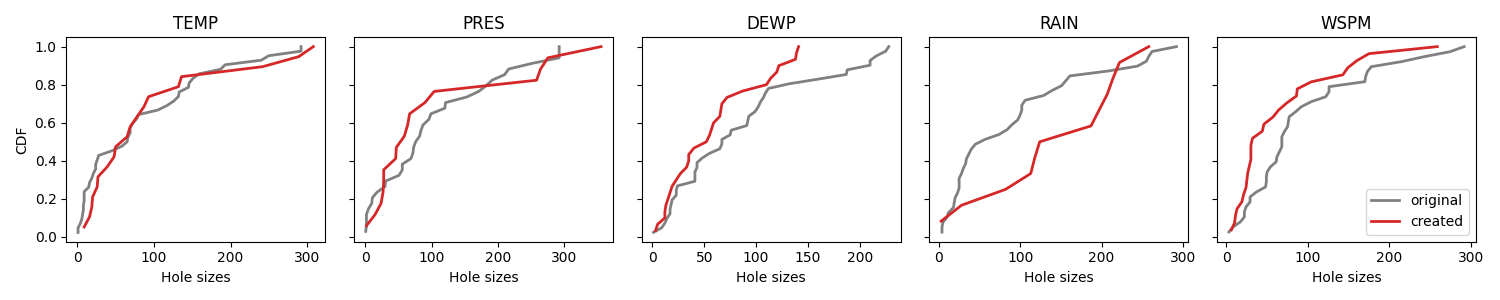
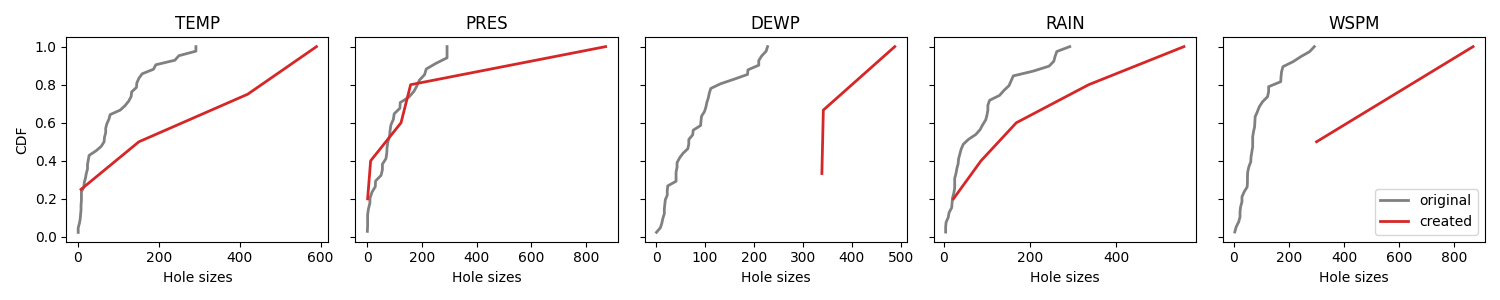
Again we compare CDFs. This time we notice that the distributions are much more similar.
plot_cdf(df, [geometric_mask], ["created"], ["tab:red"])

c. Empirical Hole Generator
The distribution of holes is learned from the data.
The distributions of holes are learned column by column; so you need to fit
the generator to the data.
This method is implemented in the
EmpiricalHoleGenerator class.
We specify groups=("station",) which means a distribution
is learned on each group: here on each station.
empirical_generator = missing_patterns.EmpiricalHoleGenerator(
    n_splits=1, subset=df.columns, ratio_masked=0.1, groups=("station",), random_state=rng
)
empirical_mask = empirical_generator.split(df)[0]

print("Percentage of additional missing values:")
print(round((empirical_mask.sum() / len(empirical_mask)) * 100, 2))
visualise_missing_values(df, empirical_mask)

Percentage of additional missing values:
TEMP    9.99
PRES    9.99
DEWP    9.99
RAIN    9.99
WSPM    9.99
dtype: float64
Again we compare CDFs. This time we notice that the distributions are much more similar.
plot_cdf(df, [geometric_mask], ["created"], ["tab:red"])
d. Multi Markov Hole Generator
The holes are generated according to a Markov process.
Each line of the dataframe mask (np.nan) represents a state of the Markov chain.
Note it is also more difficult to achieve exactly the required
missing data ratio.
This method is implemented in the
MultiMarkovHoleGenerator class.
multi_markov_generator = missing_patterns.MultiMarkovHoleGenerator(
    n_splits=1, subset=df.columns, ratio_masked=0.1, random_state=rng
)
multi_markov_mask = multi_markov_generator.split(df)[0]

print("Percentage of additional missing values:")
print(round((multi_markov_mask.sum() / len(multi_markov_mask)) * 100, 2))
visualise_missing_values(df, multi_markov_mask)
Percentage of additional missing values:
TEMP    4.87
PRES    6.37
DEWP    3.37
RAIN    8.99
WSPM    2.98
dtype: float64
Even if the distribution is learned multivariately, we can still plot the CDFs of each column.
plot_cdf(df, [multi_markov_mask], ["created"], ["tab:red"])
e. Grouped Hole Generator
The holes are generated according to the groups defined by the user.
This method is implemented in the
GroupedHoleGenerator class.
grouped_generator = missing_patterns.GroupedHoleGenerator(
    n_splits=1, subset=df.columns, ratio_masked=0.1, groups=("station",), random_state=rng
)
grouped_mask = grouped_generator.split(df)[0]

print("Percentage of additional missing values:")
print(round((grouped_mask.sum() / len(grouped_mask)) * 100, 2))
visualise_missing_values(df, grouped_mask)

Percentage of additional missing values:
TEMP    6.67
PRES    6.67
DEWP    6.67
RAIN    6.67
WSPM    6.67
dtype: float64
Again we compare CDFs.
plot_cdf(df, [grouped_mask], ["created"], ["tab:red"])
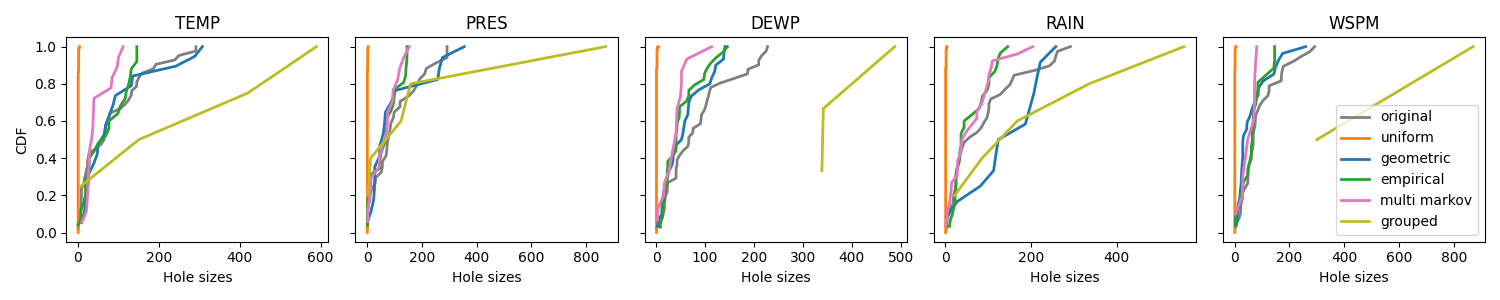
Finally, we can compare the generators by looking at the CDF of each column, while keeping in mind the the functioning of the Multi Markov generator.
plot_cdf(
    df,
    [
        uniform_mask,
        geometric_mask,
        empirical_mask,
        multi_markov_mask,
        grouped_mask,
    ],
    ["uniform", "geometric", "empirical", "multi markov", "grouped"],
    ["tab:orange", "tab:blue", "tab:green", "tab:pink", "tab:olive"],
)
Total running time of the script: (0 minutes 6.592 seconds)